AOTA Releases Report on 2009-2021 Occupational Therapy Medicare Spending and Utilization
The American Occupational Therapy Association (AOTA) recently engaged the Moran Company, a Health Management Associates (HMA) Company, to analyze 2009-2021 Medicare Fee for Service (FFS) claims data and assess Medicare spending and utilization of Part B outpatient occupational therapy services. AOTA was also interested in Medicare therapy spending and volume information by place of service (POS), including office, skilled nursing facility (SNF), and hospital outpatient departments (HOPD), as well as code-level analysis for a subset of therapy services. AOTA is sharing key findings from the analysis of the claims data below. For more detailed information, you can review the AOTA/Moran Company PowerPoint presentation.
Key Findings
- Medicare payments for outpatient Part B therapy services increased by approximately 48% over the 12-year timeframe, from 2009 to 2021. Medicare payments on outpatient therapy services attributable to occupational therapy increased from $1,079 million to $1,614 million, a 50% increase.
- This was driven by an increase in aggregate volume, including a 31% increase in the number of beneficiaries utilizing outpatient therapy services.
- While aggregate volume growth is apparent, the average number of outpatient therapy claim lines per beneficiary increased by a lesser amount (7%), and the average number of OT claim lines per beneficiary dropped by ~8%.
- The average payment per claim line for therapy overall remained relatively constant, with a $2 increase (6% increase) over the 12-year period.
- While the overall trend in total Medicare payments was positive over the entire time frame, there was a drop in total payments in 2013 across all therapy types. This coincided with the implementation of the Multiple Procedure Payment Reduction (MPPR) – whereby CMS implemented a 50% payment reduction to the practice expense value of certain HCPCS codes deemed "always therapy” services.
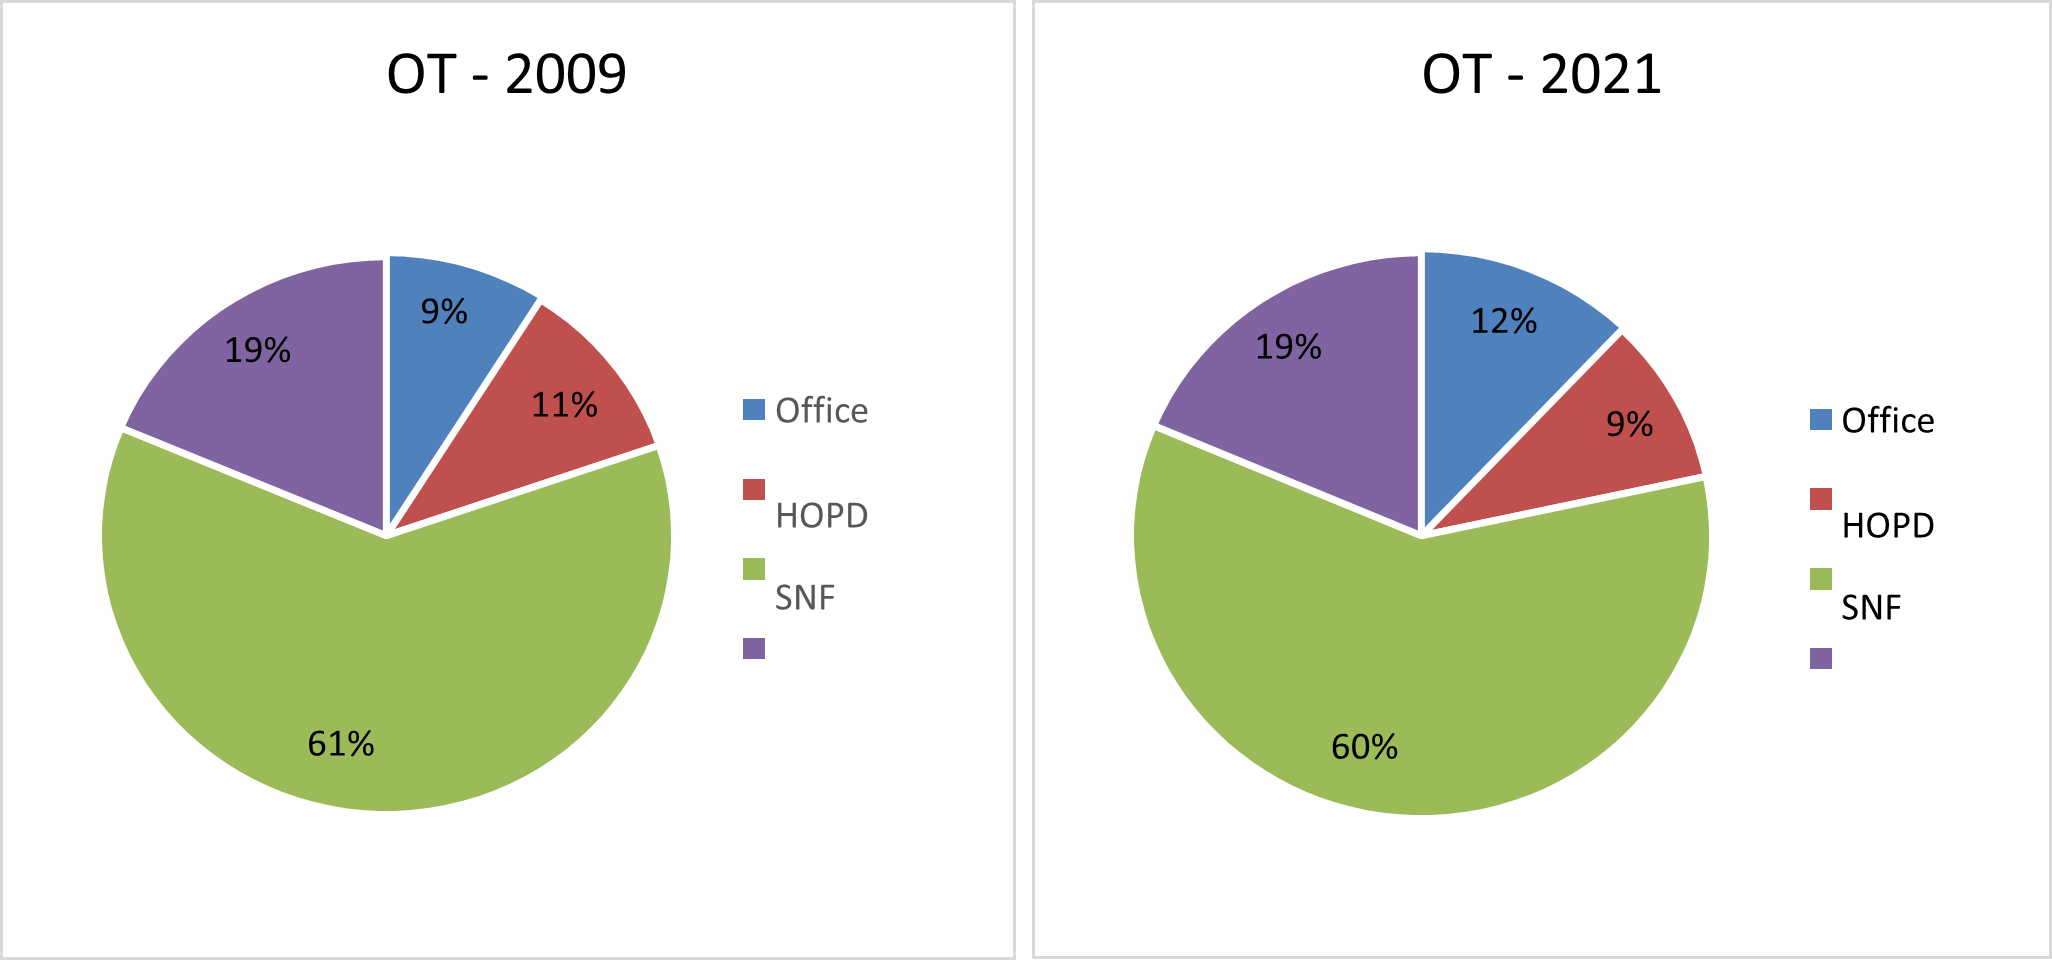
- The place of service (POS) distribution changed very slightly between the years. Overall, 34-38% of the total Medicare payments were attributable to outpatient therapy services provided in the office setting, 13-16% of the payments were attributable to hospital outpatient departments (HOPDs), and 31-38% were attributable to skilled nursing facilities (SNFs) providers of outpatient therapy.
Figure 4. Place of service (POS) Distribution of Total Medicare Payments for OT – 2009 and 2021
Code Level Highlights
- The top 10 occupational therapy codes contributed to more than 90% of the total Medicare payments for outpatient OT services.
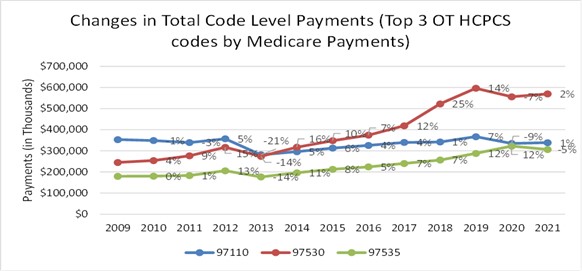
- The trends in Medicare payments per claim between 2009-2021 varied by codes - while some codes, such as HCPCS code 97760 (Orthotics management and training), had a 25% increase in payments, other codes, such as 97150 (Group therapeutic procedures), had a 20% decrease.
Figure 11. Year-over-year changes in code level total Medicare payments – Top 3 OT HCPCS codes by Medicare Payments
Occupational Therapy Medicare Growth is Fueled by More Beneficiaries Receiving Care - Not More Occupational Therapy per Beneficiary:
- Occupational therapy comprised between 17-20 percent of total therapy provided to Medicare beneficiaries in an outpatient setting from 2009 to 2021, with physical therapy and speech-language pathology comprising the rest of the volume.
- On the plus side, total Medicare payments for OT increased from $1.1B to $1.6B over that period. While the number of OT claims increased 37 percent from 2009 to 2021, this increase was driven by more beneficiaries receiving care, not by more care being provided per beneficiary. During this time, there was a 48% increase in the number of beneficiaries receiving OT services, with 1.56 million beneficiaries receiving OT services in 2021 compared to 1.05 million in 2009.
- In fact, the number of claims per beneficiary dropped 6.9% during that period.
Multiple, Cumulative Payment Cuts Result in Significant Challenges for OTPs
- The recent cuts that resulted from the rebalancing of the fee schedule and the lack of inflationary adjustments over the last eight years are layered on top of a 50% reduction to the practice expense portion of therapy codes that have been in effect since 2013, when Congress codified a multiple procedure payment reduction (MPPR) policies, originally put in place by CMS. A stark reduction in therapy payment is visible in the data beginning in 2013.
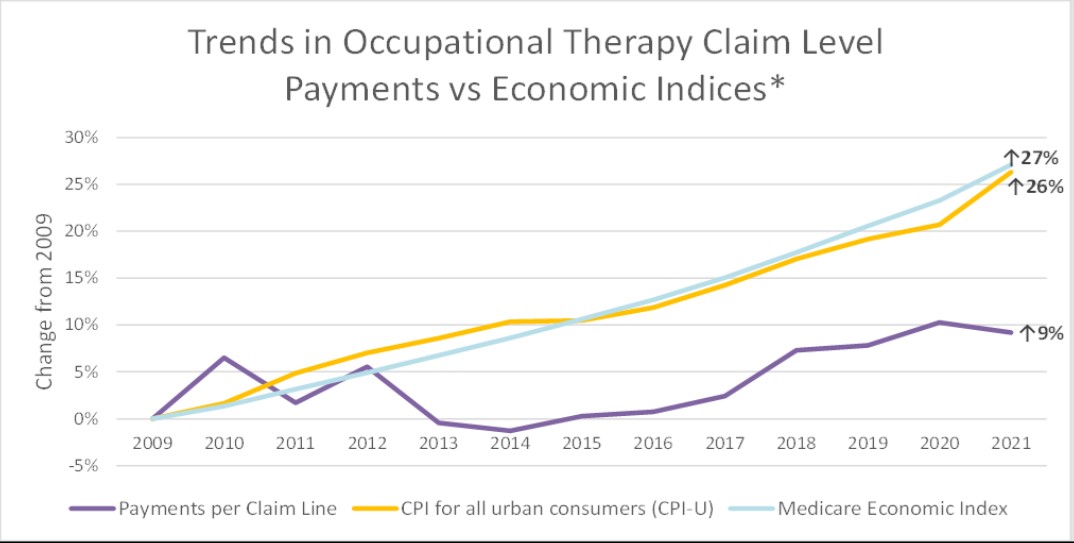
- Notably, the average payment per claim line for OT increased by 9% from 2009 to 2021, with 6% of this increase occurring between 2009 and 2010. During this time, inflation rose by 26%. It is clear that Medicare therapy payments are not keeping up with the cost of providing care, and that, in addition to raising caseloads, has a negative impact on the occupational therapy profession.
- Occupational therapy practitioners and other therapy providers were particularly hard hit by CMS’s recent redistribution of resources on the physician fee schedule to increase payments for Evaluation & Management codes because therapy practitioners cannot bill for ANY E&M codes. This resulted in a 6% cut that is now being phased in.
- To compound these cuts, as of 2022, services provided by occupational therapy assistants and physical therapist assistants are subject to a 15% payment reduction. Further, outpatient Medicare services provided by occupational therapy assistants comprise 37% of all outpatient therapy services. In rural and underserved communities, 48% of all Medicare outpatient therapy services are provided by OTAs, making them critical access points in these communities.
- Like other providers paid on the physician fee schedule, OTPs confront indefinite payment freezes, which do not account for the inflationary pressures they are experiencing. Unlike other providers, the vast majority of OTPs are not able to take advantage of incentive payments because they work in facility-based settings, such as skilled nursing facilities and hospital outpatient departments. Facility-based services are not eligible for the Medicare Quality Payment Program and Merit Based Incentive Payment System (MIPS), which provides incentives for the delivery of high-quality care.
The chart below illustrates key findings in the report, including the average Medicare payment per patient claim from 2009 to 2021. Payment per claim increased by 9% for occupational therapy and 6% for therapy services overall, substantially lagging inflation. Additionally, since 2021, payments have further decreased due to ongoing negative updates to the conversion factor and reductions in payments to occupational therapy assistants.
AOTA Advocacy Next Steps
As Congress begins considering ways to reform the Medicare Physician Fee schedule, the data from this report will help to highlight the ways in which payment for therapy services has been uniquely challenged.
The data makes it clear that Medicare beneficiaries value occupational therapy services - as seen by the 48% increase in the number who are accessing these services. The data also shows that therapy providers have been good stewards of Medicare dollars, as seen by the number of claims per beneficiary remaining relatively flat. However, this report shows that payment policy has not reflected the value of therapy services in maintaining the health and wellness of Medicare beneficiaries, thus reducing overall health care costs. AOTA, along with the American Physical Therapy Association and other therapy coalition partners, will use this data to help reverse the payment trends of the last 14 years.